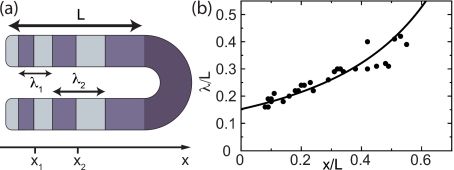
Figure 7. Wavelength of the pattern as a function of the position x in the PSM.
L is the length of the part of the PSM considered. (a) Schematic representation of the wavelength λ. (b) Fit of Eq. 6 to the experimental data obtained from wildtype zebrafish in Giudicelli et al. (2007). Best fit parameters are μ=1.08 and ν(1+η)=57.8. (μ, ν, and η are dimensionless quantities defined in the Methods section.)

