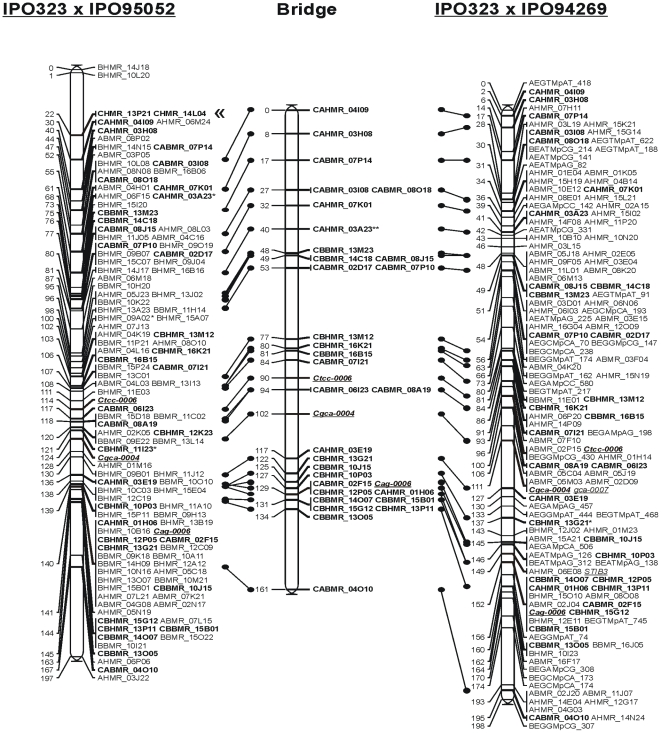
Figure 1. Co-linearity of genetic linkage maps for Mycosphaerella graminicola crosses IPO323×IPO95052 (left) and IPO323×IPO94269 (right) with a bridge map (middle) generated with markers that segregated in both crosses.
Common markers are shown in bold and start with the prefix C, SSR markers are shown in blue and markers that are translocated in red. DArT markers were named according to phase of the marker (A = IPO323, B = IPO95052 or IPO94269), complexity reduction method used (BMR or HMR), and location in the spotting plate (e.g. BBMR_15L11). LG and AFLP nomenclature is according to Kema et al., 2002. Segregation distortion of the markers is indicated with * (P<0.05), ** (P<0.01), *** (P<0.005) or **** (P<0.001).

