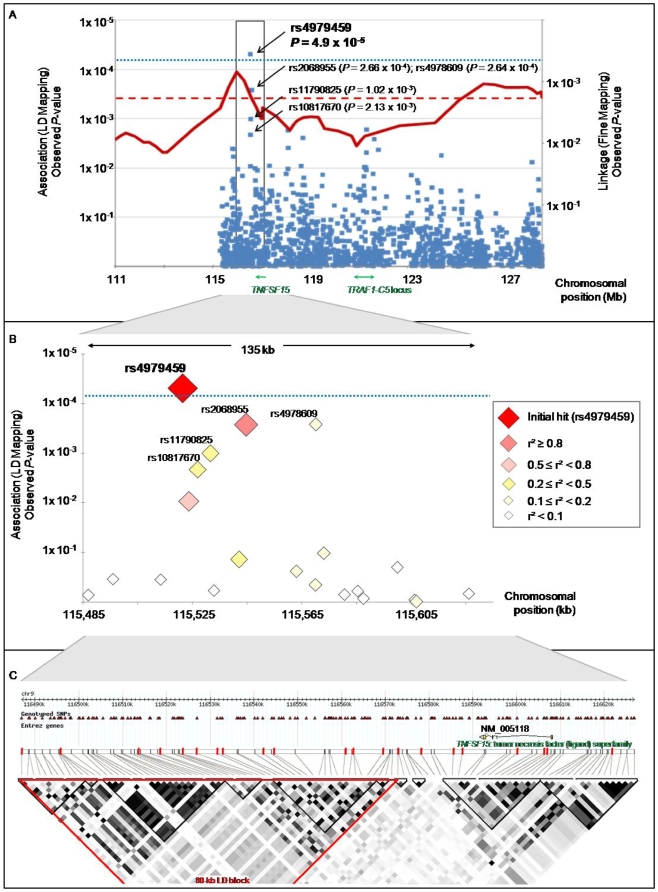
Figure 2. Results of linkage disequilibrium mapping association study.
(A) shows results of both fine mapping linkage step (right y axis) and LD mapping step (left y axis). Linkage results are shown in red, with the dashed straight line symbolizing the 0.05 Bonferroni corrected significance threshold. Family-based association results are displayed in blue, with each diamond corresponding to a studied tag SNP. The dotted straight line shows the 0.075 Bonferroni corrected significance threshold. In green are represented the locations of the TNFSF15 gene, associated with Crohn's disease and of the TRAF1-C5 locus associated with rheumatoid arthritis. (B) shows a zoomed view of the 135 kb region of interest delineated by frames in (A). Each diamond, corresponding to a studied tag SNP, appears coded by color and size, according to its linkage disequilibrium correlation coefficient (r2) with the most significantly associated tag SNP (rs4979459), as displayed in the legend. (C) shows linkage disequilibrium structure across the 135 kb region zoomed in (B), based on r2 coefficient calculated with the CEU HapMap database. The intron exon structure of the TNFSF15 gene lying within this locus is represented at the top of (C). The genotyped tag SNPs shown in (B) are indicated with red bars. Three of these tag SNPs lie within the TNFSF15 gene.

