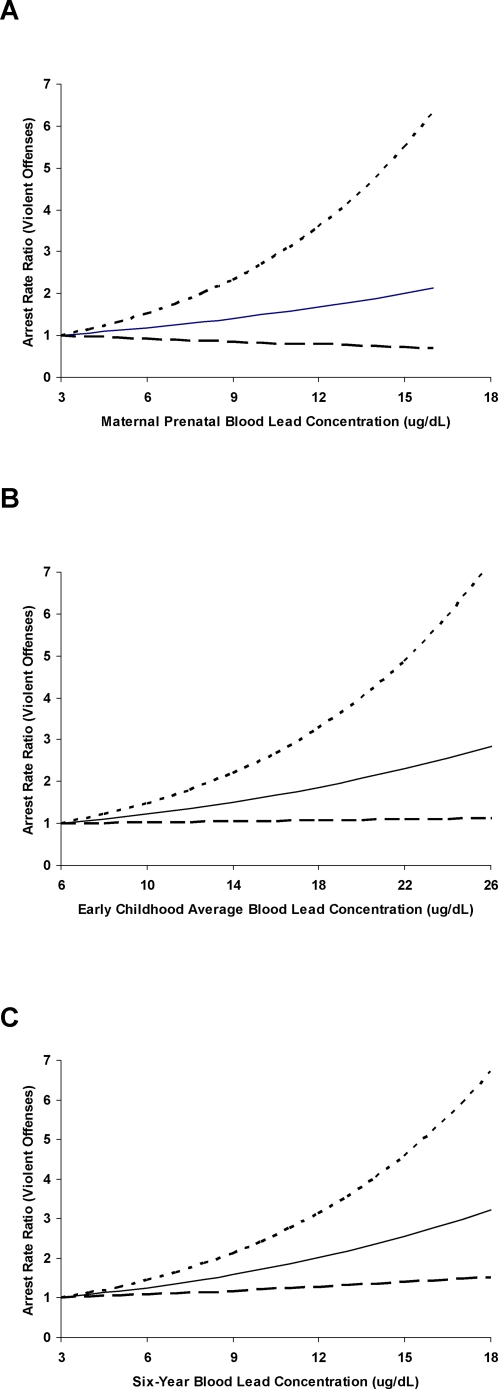
Figure 2. Adjusted Relationship between Blood Lead Concentration and Arrest Rate Ratio For Violent Offenses.
Shown are data for maternal prenatal blood lead concentration (A), early childhood average blood lead concentration (B), and 6-year blood lead concentration (C). Rate ratios are plotted as a function of increasing blood lead from the 5th to the 95th percentiles of blood lead relative to participants at the 5th percentile. Dashed lines are 95% confidence intervals. To convert to μmol/l: (μg/dl) × 0.04826.

