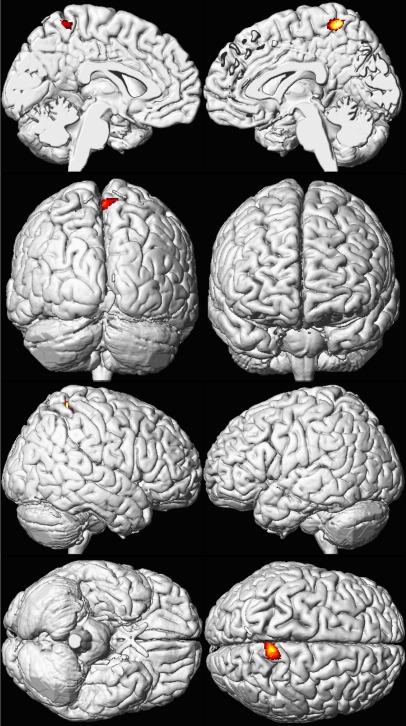
Figure 5. Sex Influences Brain Volume Loss Associated with Lead Exposure (Females).
A composite representation of regions with significant volume loss for CLS participants associated with mean childhood blood lead concentrations is shown in red and yellow overlaid upon a standard brain template for females (n = 74). The model is adjusted for age at time of scanning and birth weight, using a cluster threshold of 700 voxels and unadjusted p ≤ 0.001. Views are the same as shown in Figure 1; brain template source reference [51].

