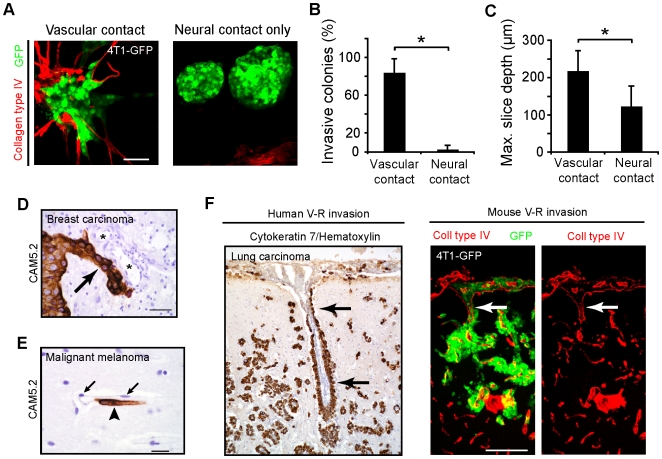
Figure 5. Angiocentric invasion of parenchyma by brain metastases.
(A) 4T1-GFP spheroids were plated onto live brain slices to assess parenchymal invasion. 4T1-GFP spheroids invaded live brain slices upon the vascular scaffolding (left), but those spheroids contacting the brain parenchyma in regions without vessels showed little morphological evidence of invasion (right). Scale bar, 60 µm. (B) The percent of invasive colonies associated with vessels was significantly higher than those in contact only with the brain (*P<0.05, Mann-Whitney U-test, 2 independent experiments). (C) The maximum depth of invasion by each spheroid into the brain slice was measured further confirming a vascular preference (*P<0.001, Mann-Whitney U-test, 2 independent experiments). (D) Example of collective angiotropic invasion (arrow) from a human specimen of brain metastasis from breast carcinoma. Asterisks, vessel lumens. Scale bar, 50 µm. (E) Example of single-cell angiocentric invasion (arrowhead) in the brain from a human specimen of malignant melanoma brain metastasis. Arrows show endothelial cell nuclei. Scale bar, 20 µm. (F) Left, angiocentric parenchymal invasion (arrow) was observed to occur from the Virchow-Robin spaces in human cases with carcinomatous CNS spread (lung carcinoma, scale bar, 100 µm) as mirrored in the 4T1-GFP mouse model, right (scale bar, 120 µm). All error bars represent s.d.

