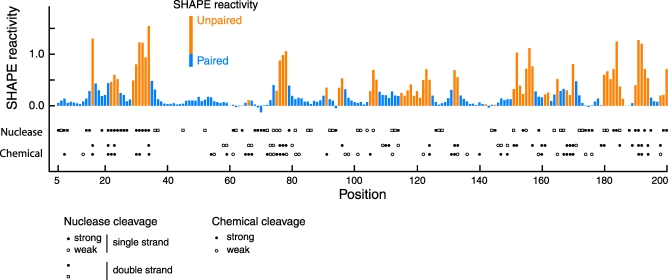
Figure 9. Density of SHAPE Reactivity Information Compared with Analyses of Related HIV-1 Sequences Using Conventional Chemical and Enzymatic Probes.
The histogram illustrates SHAPE reactivity as a function of position for the in vitro transcript RNA. Bars are colored according to whether the nucleotide is predicted to be paired (blue) or single stranded (orange). The results of nuclease mapping [15] (HXB2 isolate) and chemical mapping studies [8,16] (top, HXB2; bottom, MAL) are indicated below the SHAPE histogram. All mapping data were aligned with the HIV-1 NL4–3 sequence. This plot shows the most information-dense genome regions as analyzed by conventional approaches; significantly less information was available 3′ of position 360, and none was available 3′ of position 720 in the first 10% of the HIV-1 genome.

