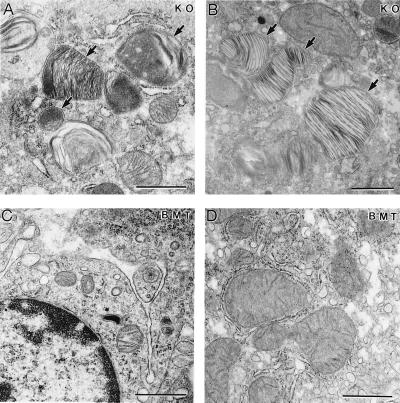
Figure 7.
EM analysis of liver sections from α-Gal A −/0 mouse (KO) and α-Gal A −/0 mouse 6 mo after BMT. (A) A Kupffer cell and (B) a hepatocyte with distinct lipid inclusions (arrows) from a 40-wk-old α-Gal A −/0 mouse. (C) A Kupffer cell and (D) a hepatocyte from α-Gal A −/0 mice 6 mo after BMT. (Bar = 1 μm.)

