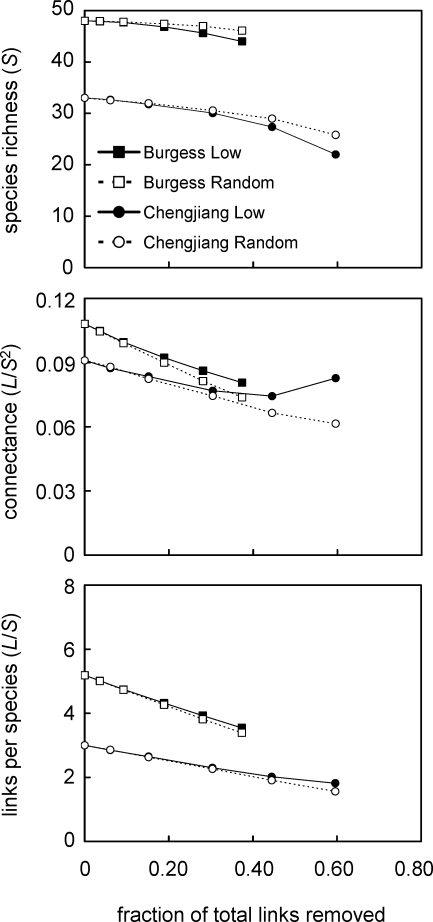
Figure 2. The Response of Species Richness (S), Connectance (L/S2) and Links per Species (L/S) to Link Removal in Two Cambrian Food Webs.
Each data point shows the mean value across 100 webs for that level of link removal (except for 100% removal of low-certainty links and 0% removals, which show single values). Burgess Low and Chengjiang Low show data for removal of low-certainty links, and Burgess Random and Chengjiang Random show data for removal of random links.

