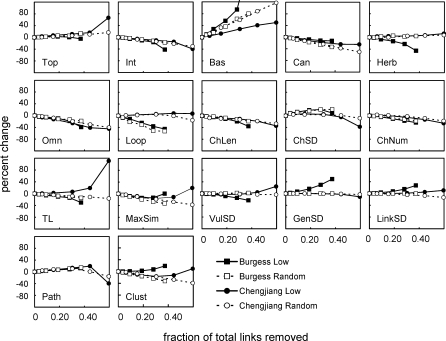
Figure 3. The Response of 17 Structural Properties to Link Removal in Two Cambrian Food Webs.
The data are shown in terms of percent change, or the difference between each new mean property value and the original property value, divided by the original property value, multiplied by 100. Mean property values are averaged across 100 webs for that level of link removal (except for 100% removal of low-certainty links and 0% removals, which show single values). Burgess Low and Chengjiang Low show data for removal of low-certainty links, and Burgess Random and Chengjiang Random show data for removal of random links.

