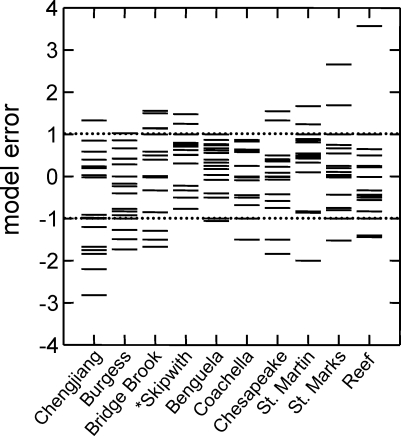
Figure 5. Distribution of Niche Model Errors for Cambrian and Modern Food Webs.
Each column of stacked horizontal lines shows the MEs for 17 properties for a particular food web. The MEs for the Cambrian webs are shown in the first two columns, and the MEs for eight modern webs, in order of increasing species richness, are shown in the following columns. The dotted horizontal lines show ME = ±1. MEs within this range are considered to show a good fit of the model to the data. One very large ME, Herb = −7.00 for Skipwith, is not shown.

