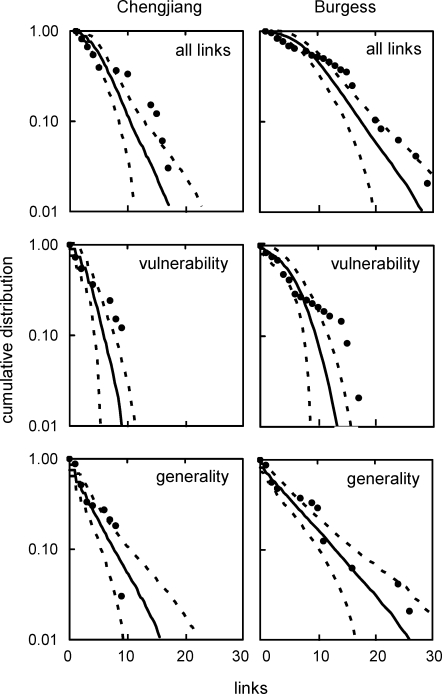
Figure 7. Cumulative Link Distributions for Two Cambrian Food Webs Compared to Niche Model Predictions.
The data are presented in semilogarithmic format. “All links” graphs show distributions of consumer plus resource links, “vulnerability” graphs show distributions of numbers of consumer species per species (i.e., number of links from consumers), and “generality” graphs show distributions of numbers of resource species per species (i.e., number of links to resources). Filled circles show empirical data. Solid lines show mean niche model simulation results for webs with the same S and C as the two Cambrian webs (n = 500), with 95% confidence intervals (±1.96 SD) shown by dashed lines.

