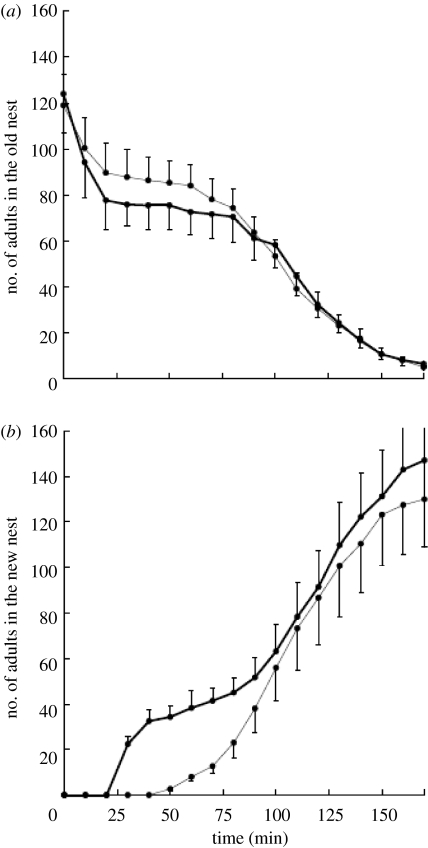
Figure 3.
Experiment 2. In the treatment, scouts were released in the arena with the new nest. In the control, scouts were released in the arena with the old nest. Mean numbers of individuals in the (a) old and (b) new nests for colonies from the control (grey line) or treatment (black line) group as a function of time since the old nest was destroyed. The error bars represent standard errors. In the treatment group, the ants used many reverse tandem runs. In the control group, the ants used many FTRs. RTRs can expedite emigrations.

