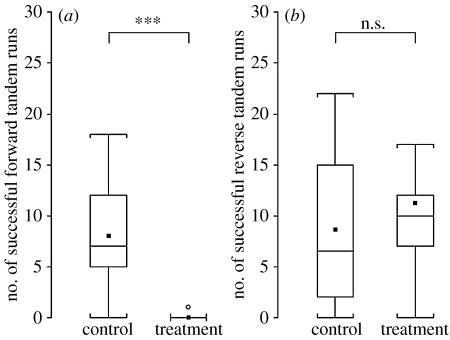
Figure 4.
Experiment 1. Box-plots of the number of successful (a) forward and (b) reverse tandem runs in control and treatment groups (10 colonies in each group). Horizontal lines within boxes are medians, boxes show inter-quartile ranges and whiskers show entire range (excluding the outliers represented by circles). The squares indicate means. ***p<0.001.

