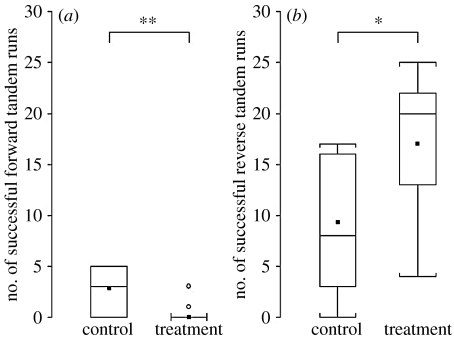
Figure 5.
Experiment 2. Box-plots of the number of successful (a) forward and (b) reverse tandem runs in control and treatment groups (10 colonies in each group). Interpretation of box-plots and symbols as in the legend of figure 4. **p<0.01, *p<0.05.

