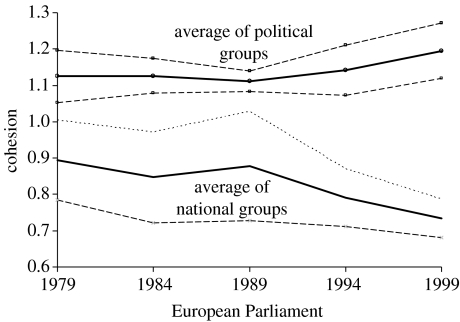
Figure 1.
Party and national voting cohesion in the European Parliament in the first five directly elected European Parliaments. The figure shows the average cohesion of the political groups and national groups of MEPs in all the roll-call votes in each European Parliament between 1979 and 2004. The figure was calculated from the data used in Hix et al. (2007).

