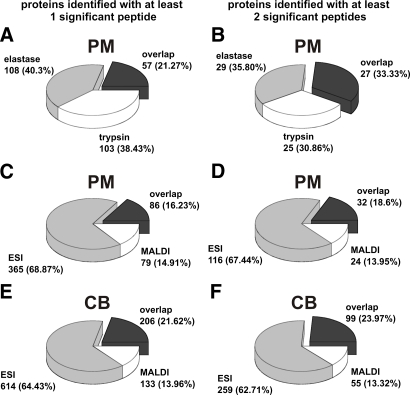
Fig. 2.
Pie charts representing overlap as well as enzyme- and instrument-exclusive protein hits, respectively. A and B display the comparison of elastase and tryptic digests of PM analyzed by nLC-MALDI-TOF/TOF. The remaining diagrams demonstrate the protein distribution among the MALDI and ESI instruments: C and D for PM digests; E and F for CB digests. Left-hand charts A, C, and E include one-hit wonders; right-hand charts B, D, and F only factor in proteins with at least two significant peptides.

