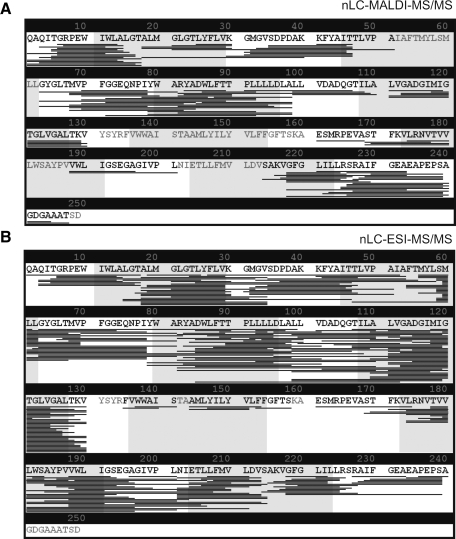
Fig. 4.
BR sequence coverage display. Identified peptide locations are indicated by thin bars underneath the protein sequence. TM stretches are indicated by gray shading. A, significant peptides identified in the nLC-MALDI MS/MS work flow. B, significant peptides identified in the nLC-ESI MS/MS work flow.

