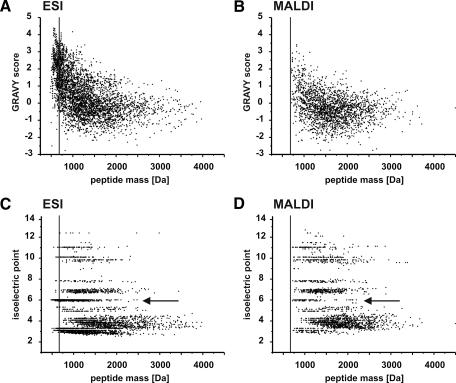
Fig. 6.
Instrument comparison of peptide GRAVY and pI values. ESI (A) and MALDI (B) peptide GRAVY scores plotted against calculated masses are shown. ESI (C) and MALDI (D) peptide pI values plotted against calculated masses are shown. Arrows indicate clusters of neutral aliphatic peptides, which are significantly reduced on the MALDI instrument. The small peptide (<700 Da) threshold is indicated by a vertical line.

