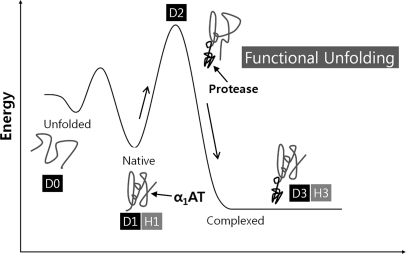
Fig. 2.
Energy diagram for the conformational change of α1AT during complex formation with a target protease. Functional unfolding during complex formation is illustrated as a process to overcome the highest energy barrier. D0 is a fully deuterated α1AT, D1 is the deuterated native form of α1AT, D2 is α1AT that is deuterated during complex formation with β-trypsin, and D3 is the deuterated α1AT-β-trypsin complex in D2O. H1 and H3 indicate the native α1AT and the α1AT-β-trypsin complex in H2O, respectively.

