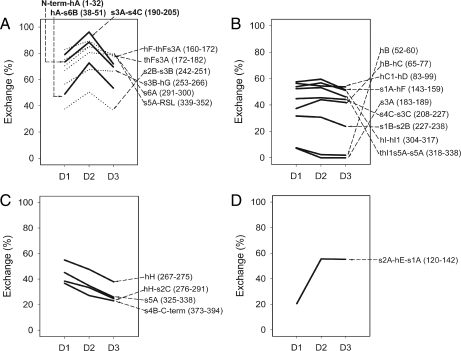
Fig. 5.
H/D-EX pattern of 23 representative peptic fragments. A, group A showed a D2-specific exchange pattern. Solid lines indicate peptides with a greater than 15% increase in D2-specific H/D-EX, and dotted lines indicate peptides with a 5–15% increase in D2-specific H/D-EX. B, group B showed little change in H/D-EX among the three states. C, group C showed a decreasing pattern in H/D-EX from D1 to D2 to D3. D, group D showed an increasing pattern in H/D-EX from D1 to D2 to D3. Note that the average of percent change error (n = 2) in 23 representative peptic fragments was ±3.81% (D1, ±5.08%; D2, ±2.97%; D3, ±3.42%).

