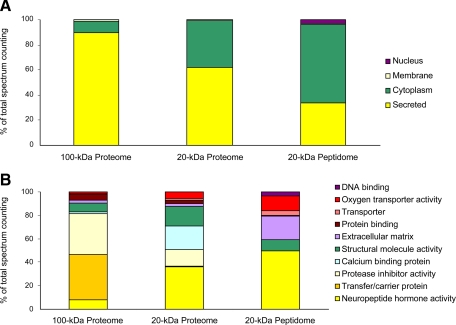
Fig. 3.
SC of microdialysate sampled with 20- or 100-kDa cutoff points. SC was obtained from proteome and peptidome data. Proteome, samples collected with either 100- or 20-kDa-cutoff membranes and undergoing trypsin digestion before MS analysis. Peptidome, samples collected with 20-kDa-cutoff membranes and submitted to MS analysis without trypsin digestion. For the 100-kDa proteome, six biological samples were analyzed. For the 20-kDa proteome and peptidome, three biological samples were studied. SC was grouped from cellular localization (A) and molecular function (B).

