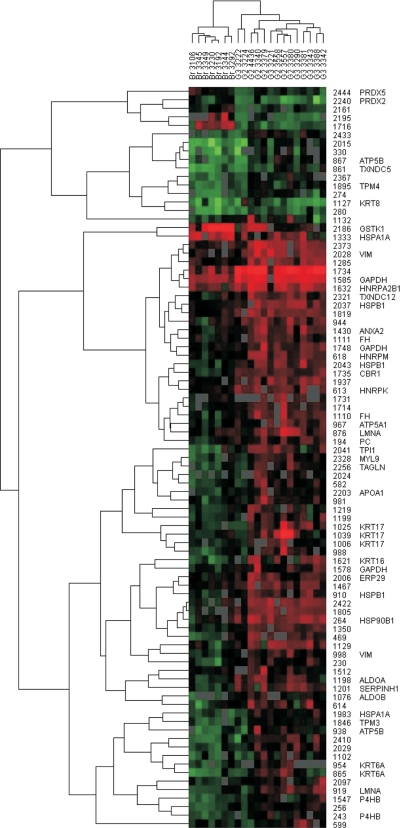
Fig. 4.
Hierarchical clustering of 2D DIGE spot data. Normalized and standardized spot volumes were subjected to a hierarchical complete linkage clustering algorithm. 85 protein spots are included showing a differential regulation (t test p < 0.05, -fold change >3.4 or <−3.4) in at least one of the comparisons of normal bronchial epithelium and G2 or G3 grade tumors. The identities of differential regulated spots are given on the right side of the heat map as well as the gene symbols of proteins identified using mass spectrometry (supplemental Table 3). Red squares in the heat map represent high spot intensities, whereas green squares represent low spot intensities. The normal bronchial epithelium samples are clearly separated from the SCC (G2 and G3) samples. VIM, vimentin; GAPDH, glyceraldehyde-3-phosphate dehydrogenase; HNRP, heterogeneous nuclear ribonucleoprotein; LMNA, lamin A; ALDOA, aldolase A; TAGLN, transgelin; PC, pyruvate carboxylase; FH, fumarate hydratase.

