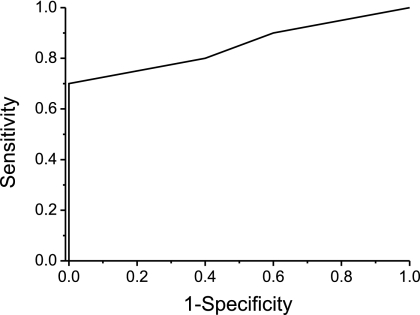
Fig. 6.
Receiver operation characteristic curve describing the discrimination of G2 and G3 grade SCC tumors using anti-cytokeratin 17 immunostaining. 15 SCC tissues (10 G2 and five G3 grade tumors) were stained, and the staining was scored considering the staining intensity and number of stained tumor cells.

