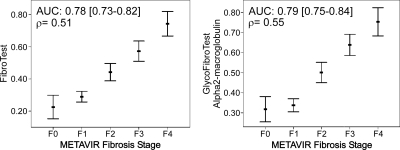
Fig. 4.
FibroTest and the combination of GlycoFibroTest with α2-macroglobulin in a binary logistic regression model are plotted against METAVIR fibrosis stage. The model was constructed using clinically significant fibrosis (F2–F4) as the dependent variable. The error bars represent 95% confidence intervals for the mean. The AUC (95% CI) to distinguish significant fibrosis (F2–F4) from insignificant fibrosis (F0–F1) is given together with the Spearman ρ correlation (F1–F4).

