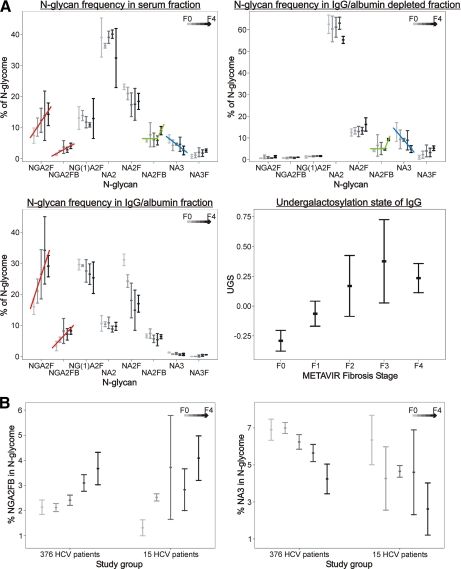
Fig. 6.
N-Glycan distribution in each fraction and correlation of the undergalactosylation state of IgG with METAVIR fibrosis stage (A) GlycoFibroTest components plotted against METAVIR fibrosis stage: comparison between the study groups (B). A, the total signal of the 12 analyzed glycans was used to normalize the abundance of each glycan species. The undergalactosylation state of IgG is the log-transformed ratio between the core-fucosylated biantennary agalacto sugar (NGA2F) and its galactosylated counterpart (NA2F). B, the concentrations of both GlycoFibroTest components (NGA2FB and NA3) in the serum N-glycome were plotted against the METAVIR classification of liver fibrosis for two patient populations. The first population consists of 376 HCV patients (main study group); the second consists of 15 HCV patients (IgG study group). For the analyzed N-glycans, a similar trend is observed in both populations. The error bars represent the 2× S.E. Lightest gray, F0; light gray, F1; medium gray, F2; darkest gray, F3; black, F4.

