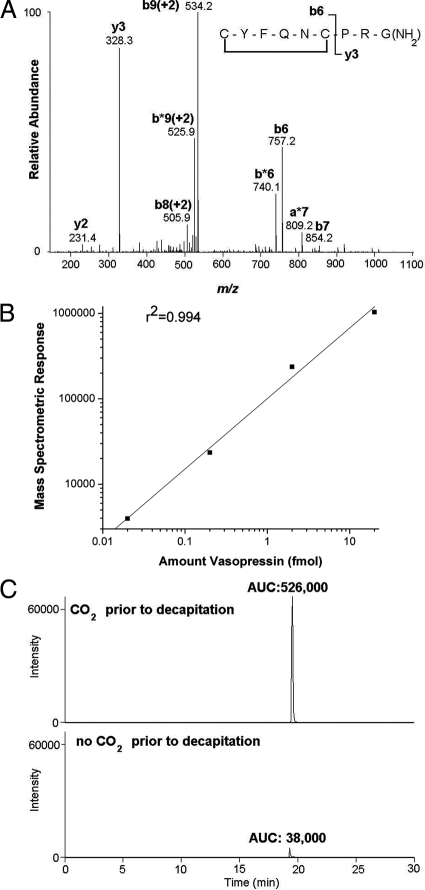
Figure 2.
Mass spectrometric detection of AVP. A, Fragmentation pattern of AVP: the most prominent fragments resulting from internal cleavage sites correspond to cleavage of the N-terminal cyclic moiety from the C-terminal tripeptide PRGamide, resulting in the y3 and b6 ions. B, AVP standards (0.02, 0.2, 2, and 20 fmol) were loaded in succession onto the capillary-liquid chromatography column and the eluent monitored via tandem mass spectrometry. Ms2, mass chromatogram: doubly charged ion of AVP served as the precursor ion: m/z, 543.0 [ms2 precursor ion 543.0 m/z; product ion monitoring of 328.2 m/z]. The base peak was set to correspond to the y3 product ion (328.3), and the resulting peaks were integrated using Xcaliber software (Thermo Scientific). The integrated peak areas are plotted vs. the amount of AVP loaded onto the column; a linear relationship for the amounts tested was found (r2 = 0.994). C, Capillary-liquid chromatography-mass spectrometric detection of endogenous AVP in plasma. Ms2 mass chromatograms [ms2 precursor ion 543.0 m/z; product ion monitoring of 328.2 m/z] of plasma from representative rats exposed to CO2 (upper plot) or decapitated without CO2 exposure (lower plot), with the base peak set to the y3 ion, 328.3. Integration of the peaks is indicated by the resulting area under the curve (AUC). The ms2 spectra were compared with the spectra from standard AVP (A) to confirm that the peaks shown correspond to authentic endogenous AVP.

