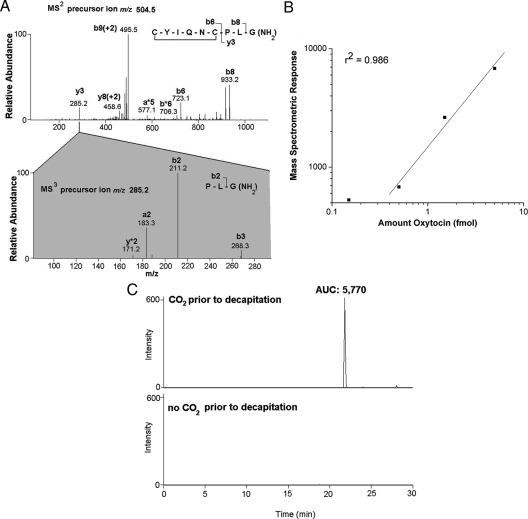
Figure 3.
Capillary-liquid chromatography-mass spectrometric detection of endogenous oxytocin in plasma. A, Ms2 and ms3 spectra of oxytocin in a representative rat exposed to CO2, with m/z for precursor ions: 504.5 in the ms2 spectrum (doubly charged oxytocin), 285.2 in the ms3 spectrum (the y3 product ion of the oxytocin precursor ion), showing clear correspondence to endogenous oxytocin, with observed ions marked on the inset peptide backbone fragmentation diagram. B, Using oxytocin standard peptide in PBS, we determined the linearity and estimated the detection limits of oxytocin. With 5 fmol, the area under the curve (AUC) of the integrated peak of oxytocin ms3 [precursor ion 1 = 504.5 m/z, doubly charged oxytocin; precursor ion 2 = 285.2 m/z, y3 product ion, product ion monitoring of 211.2 m/z], was 6820. The AUC was linear as the concentration was decreased an order of magnitude, to 0.5 (AUC of 0.5 fmol, 680) (r2 = 0.986). Measurements of AUC less than 600 were not reliable, without correspondence to concentration and spectra typically lacking other fragment ions corresponding to the 285.2 product ion (A). Although the AUC for 0.15 fmol of oxytocin is plotted, it was not included in the regression line. C, Ms3 chromatograms [precursor ion 1 = 504.5 m/z, doubly charged oxytocin; precursor ion 2 = 285.2 m/z, y3 product ion, product ion monitoring of 211.2 m/z], for representative rats exposed to CO2 (upper chromatogram) or not exposed to CO2 (lower chromatogram). There was no oxytocin detected, using ms3 fragmentation criteria, in the absence of CO2, whereas we observed oxytocin with AUC of 5770 after CO2 exposure.

