Figure 1.
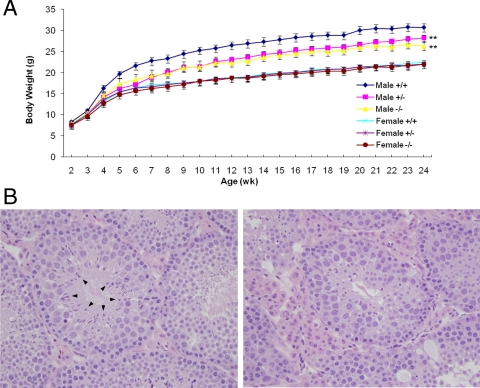
Mouse growth and fertility. A, Growth curves. The data are presented as mean body weight ± sem at each age for six sex-by-genotype groups (n = 13–24 per group). **, P < 0.01 (overall comparison with same-sex wild-type control mice). B, Histological analysis of the testis. Wild-type (left) and Galnt3-deficient (right) mice at 23 wk of age. Arrowheads indicate spermatozoa in the seminiferous tubules of wild-type mice. Hematoxylin-eosin staining. Magnifications, ×400.

