
Figure 4.
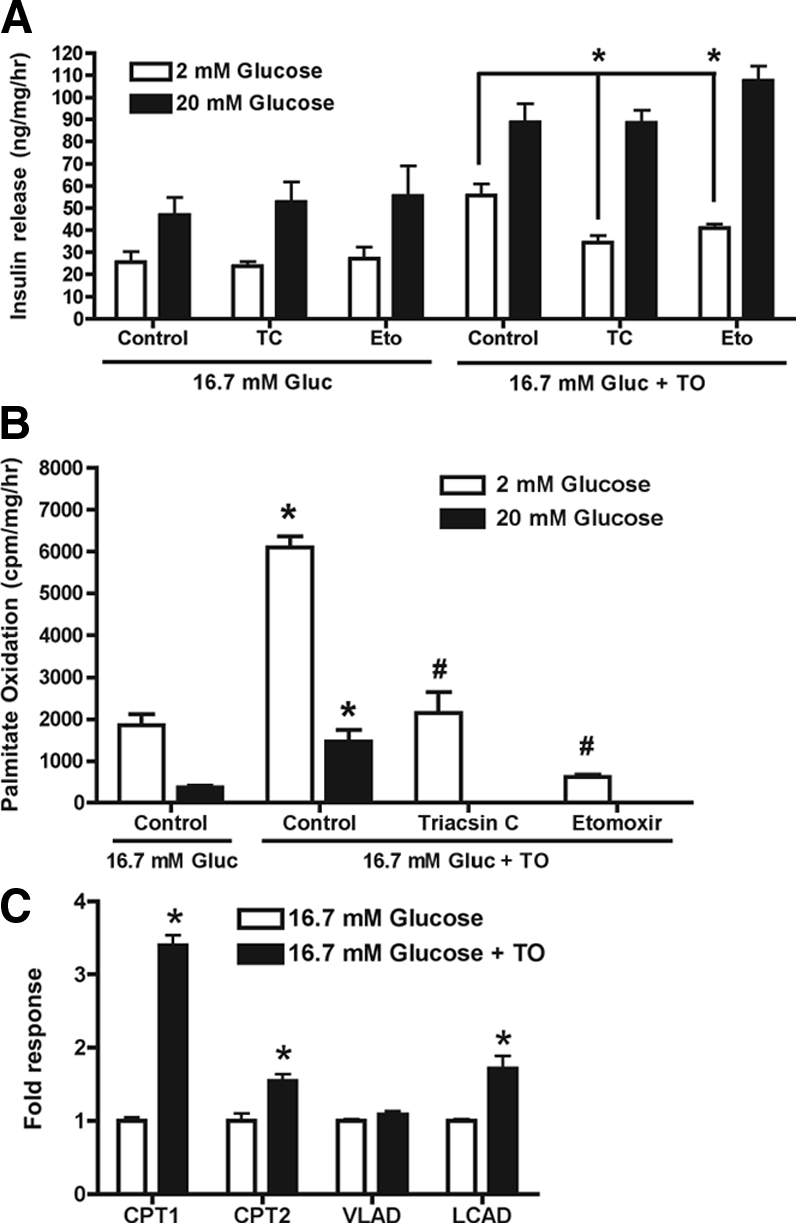
Elevated basal insulin release from LXR-activated INS-1 cells involves increased FA oxidation. INS-1 cells were incubated for 48 h in 16.7 mm glucose (Gluc) ± T0901317 (TO; 10 μm). A, Insulin release (60 min) in response to 2 or 20 mm glucose was then assessed in the presence or absence of etomoxir (Eto; 100 μm) or triacsin C (TC; 10 μm). Values are mean ± sem for six independent experiments. *, P < 0.001 when etomoxir- or triacsin C-treated cells are compared with control cells. B, FA oxidation was determined by measuring [14C]CO2 production from cells incubated for 1 h in 2 mm glucose followed by a 1-h incubation with palmitic acid (50 μm), [14C]palmitic acid, and 2 or 20 mm glucose. Data are mean ± sem for three independent experiments. *, P < 0.01 when cells cultured in 16.7 mm glucose plus T0901317 are compared with cells cultured in 16.7 mm glucose; #, P < 0.001 when triacsin C- or etomoxir-treated cells are compared with cells cultured in 16.7 mm glucose plus T0901317. C, Total RNA was extracted and mRNA levels for CPT-1α (CPT1), CPT-2, very long-chain acyl CoA dehydrogenase (VLAD), and long-chain acyl CoA dehydrogenase (LCAD) were determined by real time RT-PCR. Data are mean ± sem for three independent experiments. *, P < 0.02 when cells cultured in 16.7 mm glucose are compared with cells cultured in 16.7 mm glucose plus T0901317.