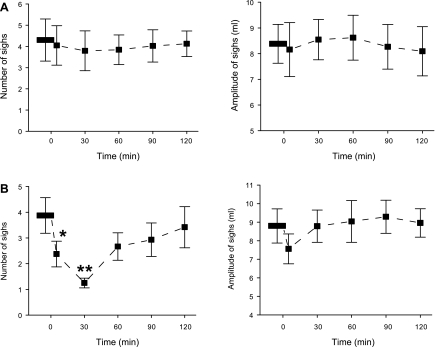
Fig. 6.
Influence of DAMGO microinjection into the mMRR on the responses of sigh number (left) and amplitude (right) to 10% O2 (A) and 7% CO2 (B). Data are presented as means ± SE; n = 6. *P < 0.05, **P < 0.01 compared with before DAMGO. “0” on x-axis indicates onset of intravenous DAMGO administration.

