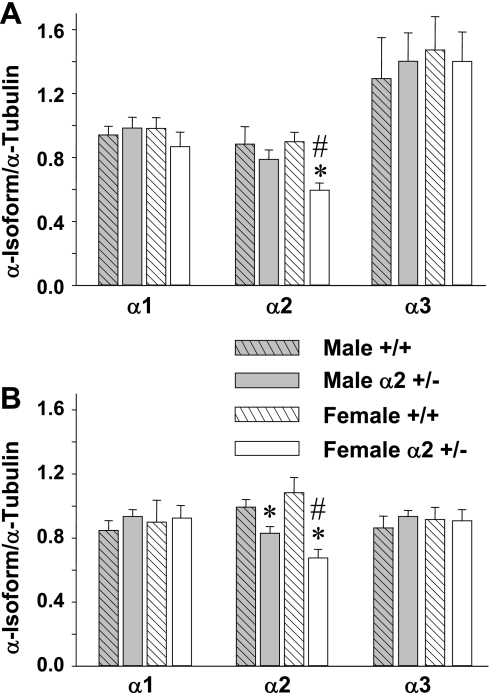
Fig. 2.
Summary of results from Western blot analyses of α-isoforms of Na+-K+-ATPase in homogenates from the hypothalamus (A) and pons/medulla (B) of 8- to 10-wk-old mice. The relative protein level for each sample is expressed as the ratio of α-isoform: α-tubulin band densities. Data from two different blots were pooled for each group, using 3 different concentrations of an identical standard on each blot for standardization. Values are means ± SE, n = 8–12 animals per group. *P < 0.05 male α2 +/− vs. male +/+ or female α2 +/− vs. female +/+. #P < 0.05 for female α2 +/− vs. male α2 +/−.

