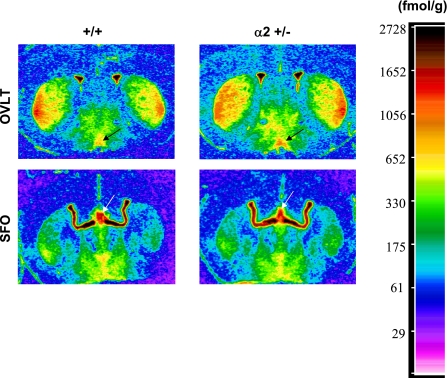
Fig. 8.
Representative densitometric scans of autoradiographs produced from the binding of a labeled ligand (125I-351A) for ACE. Shown are images from coronal sections of the brain containing the organum vasculosum laminae terminalis (OVLT) and subfornical organ (SFO) in +/+ or +/− mice, as indicated. Scale indicates standards for assessing the relative intensity of the signal. Arrows indicate the OVLT and SFO nuclei.

