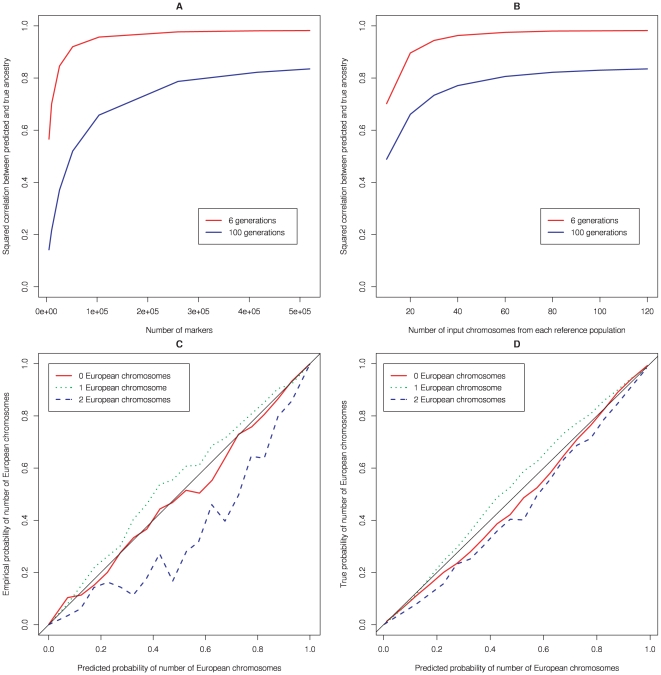
Figure 4. Properties of HAPMIX.
(A) For simulated admixed data sets, constructed as described in Materials and Methods using λ = 6 and λ = 100, we plot the r 2 between predicted and true number of European chromosomal copies, as a function of the number of markers genotyped across the genome. (B) The same as part A, except we now fix the number of markers genotyped at 500,000, and vary the number of input chromosomes used to predict ancestry (for full details, see text). (C) Calibration of uncertainty estimates produced by HAPMIX. For the λ = 6 simulations, and for each of x = 0, x = 1, and x = 2 we compare the average probability of x copies of European ancestry predicted by HAPMIX to the true frequency of having x copies of European ancestry, binning the predicted probabilities of x copies of European ancestry into bins of size 0.05. If the method were perfectly calibrated, the results would lie along the line y = x (thin black line). Note that for λ = 6, ancestry is normally inferred with high certainty, and over 98% of data points fall into the most extreme two bins. (D) The same as part A, except using λ = 100. Both the last two plots show reasonable calibration of HAPMIX.

