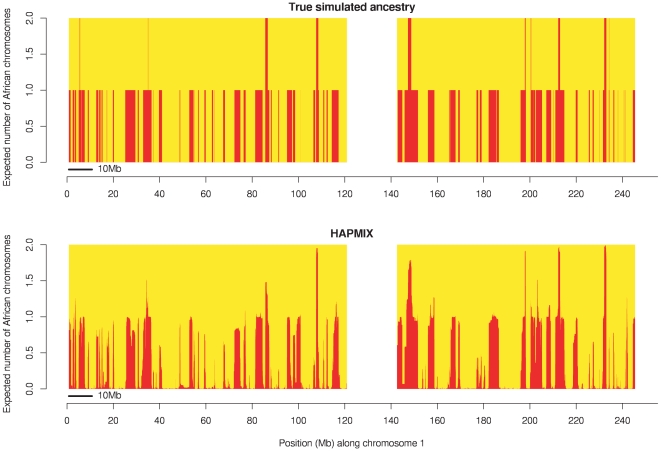
Figure 6. Local ancestry estimates produced by HAPMIX for a simulated anciently admixed sample on chromosome 1, simulated using 80% European and 20% African ancestry, with the admixture occurring 100 generations ago.
As in Figure 2, the top plot shows the truth, while the second plot shows the HAPMIX inference. We plot the true number of African chromosomes on chromosome 1 (top plot), together with the number of African copies predicted by HAPMIX (bottom plot).

