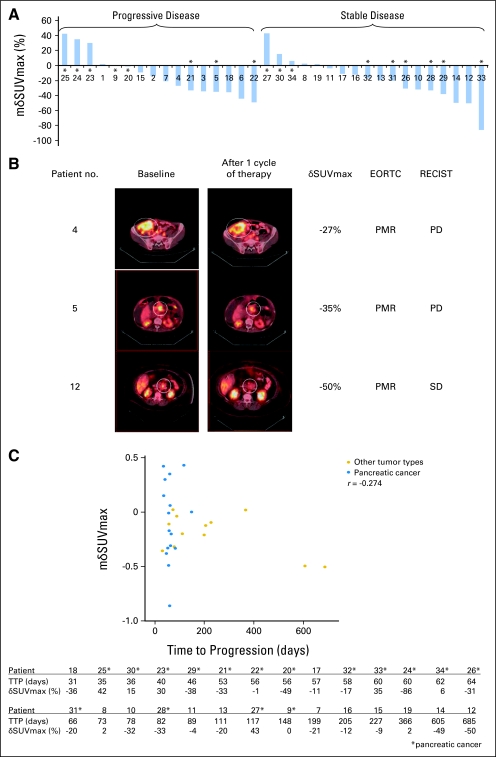
Fig 1.
[18F]Fluorodeoxyglucose positron emission tomography (FDG-PET) response was not predictive of clinical tumor response and time to progression (TTP) to rapamycin therapy in patients. Tumor response was defined by Response Evaluation Criteria in Solid Tumors (RECIST) criteria, and FDG-PET response was defined by European Organisation for Research and Treatment of Cancer (EORTC; 1999) criteria. TTP was defined as time interval from study registration to disease progression. (A) Waterfall plot of mean change in maximum standardized uptake value (mδSUVmax) in 34 patients with assessable FDG-PET scans showing that changes in mSUVmax did not correlate with tumor response. Patients with pancreatic cancer are marked with an asterisk (*). Deidentified patient numbers are listed on the x-axis for reference to patients discussed in B. (B) FDG-PET/computed tomography images of selected patients at baseline and after one cycle of rapamycin therapy. White circles denote the target lesions. Patient 4 had desmoplastic small round cell tumor, and patient 5 had pancreatic adenocarcinoma. Both had progressive disease (PD) but partial metabolic response (PMR) on FDG-PET. Patient 12 had neuroendocrine tumor of the pancreas, and had stable disease (SD), but PMR (C) Scatter plot of mδSUVmax in patients from A treated with rapamycin ≥ 5 mg daily dose (n = 28). The changes in mSUVmax did not correlate with TTP (r = −0.274 for all patients; r = 0.072 for pancreatic cancer patients). Patients with pancreatic cancer are marked with an asterisk (*). The table shows the TTP and mδSUVmax of corresponding patients.

