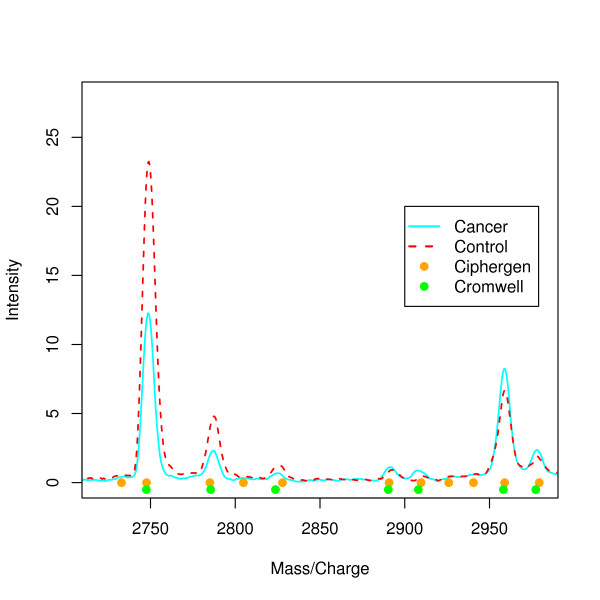
Figure 2.
Comparison of mean raw spectra for cancer and control groups. Plot of the mean raw spectra calculated for cancer (n = 14, cyan line) and control (n = 14, dashed red line) groups. Solid circles below peaks indicate peaks detected by Ciphergen (setting B, orange) and Cromwell (setting B, green) pre-processing.

