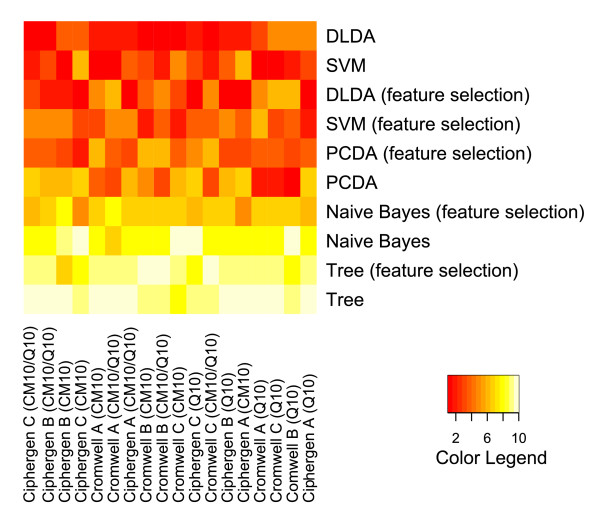
Figure 7.
Comparison of classifiers and pre-processing methods (ovarian cancer dataset). Classifiers were ranked by their average classification accuracy on 1000 test sets (size of training sets: 14, size of test sets: 14) for each specific combination of chip type, pre-processing method and peak selection settings. The heatmap gives a colour coding of the ranks from 1 (highest accuracy, red) to 10 (lowest accuracy, light yellow). Classifiers are ordered by their average rank over all combinations, with DLDA being the best ranked classifier. The columns of the heatmap are ranked by their average rank over all classifiers, with Ciphergen pre-processing using setting C and the combined CM10/Q10 data getting the highest rank (see also Additional File 8).

