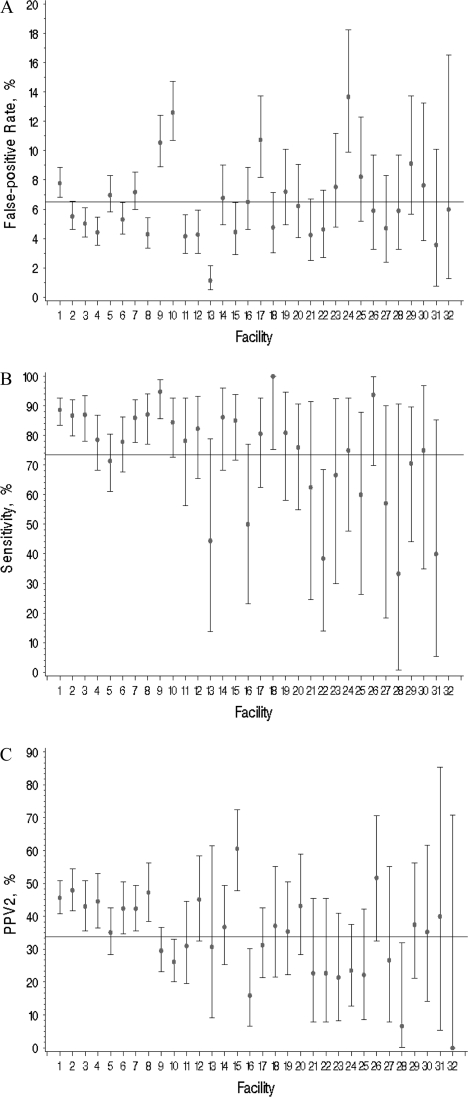
Figure 2.
Unadjusted diagnostic mammography performance measures for the 32 facilities. Overall mean at the facility level indicated by a line. A) False-positive rate. The unadjusted facility-level mean was 6.5% (95% CI = 5.5 to 7.4). B) Sensitivity. The unadjusted facility-level mean was 73.5% (95% CI = 67.1 to 79.9); facility no. 32 was without any cancers during follow-up. C) PPV2. The unadjusted facility-level mean was 33.8% (95% CI = 29.1 to 38.5). Overall mean at the facility level was computed by calculating the performance measures for each facility and taking the average across facilities. Each facility was given the same weight regardless of the number of screens interpreted at the facility. Diamonds indicate mean values; error bars correspond to 95% CIs. Facilities are ordered by number of diagnostic evaluations (highest to lowest) included in the analysis. Statistically significant variability was found across the facilities in unadjusted analyses for all performance measures (P < .01, calculated using two-sided F tests). CI = confidence intervals; PPV2 = positive predictive value of biopsy.

