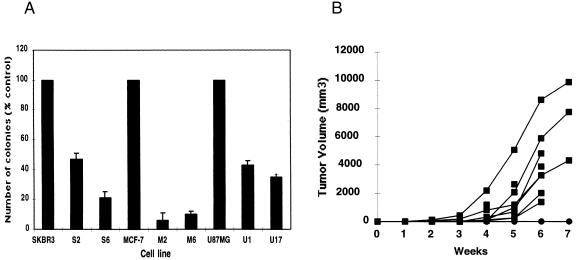
Figure 5.
Inhibition of cell growth and transformation by human TBP1. (A) Anchorage-independent growth. Cells of each clone (n = 1,000) were suspended in a 1-ml top layer [0.18% agarose/10% (vol/vol) FBS/10% (vol/vol) DMEM] in 6-cm culture dishes containing a 3-ml cell-free feeder layer consisting of 0.25% agarose in DMEM supplemented with 10% FBS and 20 mM Hepes (pH 7.5). Colonies (>0.3 mm) were visualized and counted on day 28 for all cell lines after staining with p-iodonitrotetrazolium violet (1 mg/ml). Each cell line was examined in triplicate in three separate experiments. The numbers of colonies reported represent the mean of triplicate samples. (B) Tumor growth in athymic mice: comparison of parental U87MG cells and U87/TBP1 transfectants. Cells of each cell line (n = 1 × 10⁶) were injected subcutaneously on day 0, and tumor volume was recorded weekly. These data represent individual tumor growth curves for U87MG parental cells (■) and mean tumor volumes for the U87/TBP1 subclone (●). (U87MG, n = 7; U87/TBP1, n = 8.)

