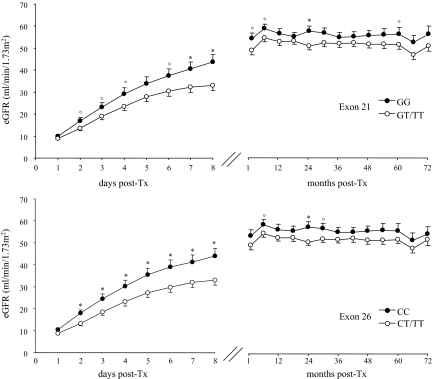
Figure 1.
Time-course of estimated GFR in 147 kidney transplant recipients during the first 8 d post-transplant (left panels) and up to the last available follow-up (right panels), divided according to ABCB1 genotypes in exon 21 (upper panels) and exon 26 (lower panels). *P < 0.01 and °P < 0.05 versus GT/TT (exon 21) or CT/TT (exon 26).

