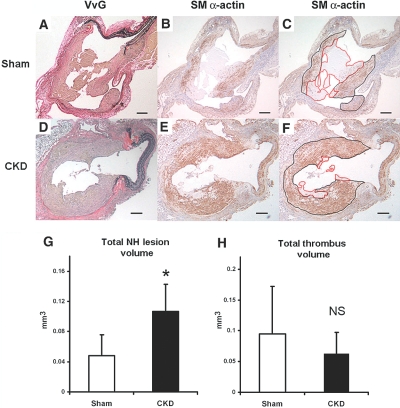
Figure 2.
NH lesion and thrombus measurements at the AV fistula anastomosis. Representative cross-sections of the venous anastomosis from sham (A to C) and CKD (D to F) mice at 3 wk after the creation of AV fistula. NH lesions were stained for elastin (VvG) (A and D) and SMCs (SM-specific α-actin) (B, C, E, and F) to identify SMCs (stained brown). SM-specific α-actin stainings show the NH lesions (black border) and the thrombus lesions (red border) of AV fistula in sham mice (C) and CKD (F). Scale bar, 100 μm in panels A to F. The total anastomotic NH lesion volume was significantly different between the sham (n = 8) and CKD (n = 10) mice (panel G, *P < 0.01). There was no significant difference (NS) in thrombus volume (H) at the anastomosis between sham and CKD mice. Error bars, 1 SD.

