Figure 4.
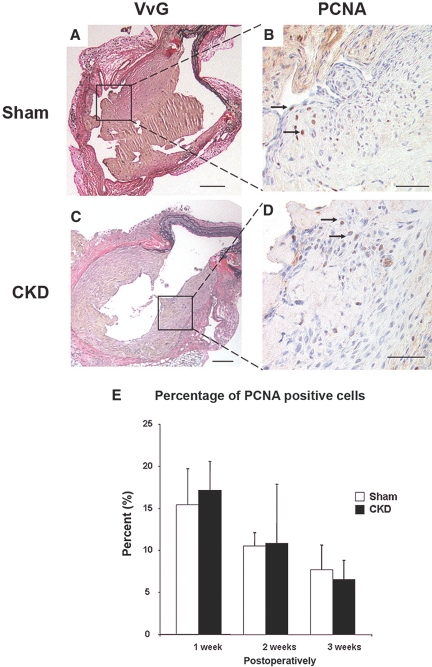
Percentage of PCNA positive cells in the CKD and sham NH lesions at 1, 2, and 3 wk postoperatively. Representative cross-sections of the venous anastomosis from sham (A and B) and CKD (C and D) mice at 3 wk after the AV fistula creation. NH lesions were stained for elastin (VvG) (A and C) and PCNA (B and D) to identify proliferating SMCs (arrows, nuclei stained brown). Scale bar, 100 μm in panels A and C. Scale bar, 25 μm in panels B and D. There were no significant differences in the percentage of PCNA positive cells in the NH lesions between the sham and CKD mice at 1 wk (sham, n = 5 mice and CKD, n = 5 mice), 2 wk (sham, n = 5 and CKD, n = 5) and 3 wk (sham, n = 8 and CKD, n = 10) postoperatively (E). Error bars, one SD.

