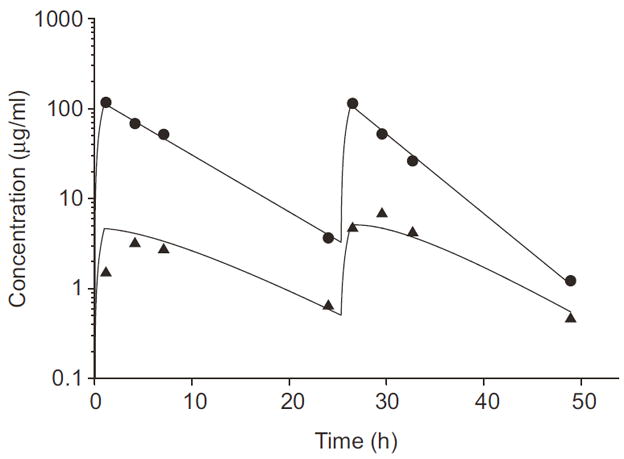
Figure 6.

Cyclophosphamide and CEPM plasma concentration–time profile in a pediatric patient after two cyclophosphamide doses of 2 g/m2 given as 1 hr intravenous infusions. Plasma cyclophosphamide concentration–time points (●) are plotted and the solid line represents the best-fit curve resulting from the pharmacokinetic analysis. Plasma CEPM concentration-time points (▲) are plotted and the dashed line represents the best-fit curve resulting from the pharmacokinetic analysis.
