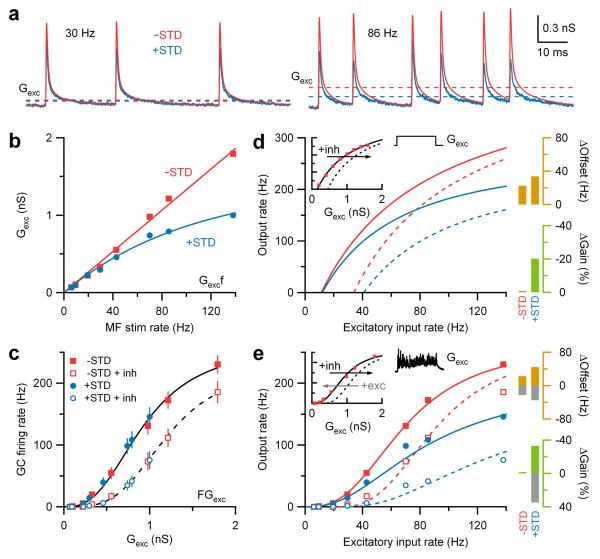
Figure 2. Synaptic depression transforms additive shifts into multiplicative gain modulation.
a, Average AMPAR-mediated synaptic trains with and without STD (blue and red) with their time-averaged conductances (Gexc, dashed lines).
b, Gexc versus MF rate f with and without STD. Red line is a linear fit (Eq. 3). Blue line is an exponential fit (Eq. 4).
c, Data in Fig. 1d plotted as output rate (F) versus Gexc. Lines are Hill fits (Eq. 5).
d, Predicted input-output relations computed from Gexcf relations in b, and experimentally measured GC FGexc relation generated with noise-free excitatory conductance steps (inset, red squares from Fig. 2b in ref. 13). Solid line in inset is a Hill fit, and dashed line is the same curve rightward shifted 0.3 nS along the Gexc-axis. Bar graphs show changes in gain (green) and offset (orange) due to inhibition with and without STD.
e, Same as d, except control FGexc data (inset) is from c during noisy synaptic excitation. The predicted change in the input-output relation for STD match the experimental observations (blue symbols). Grey bars show gain and offset changes for a leftward shift of 0.3 nS to simulate excitation.

