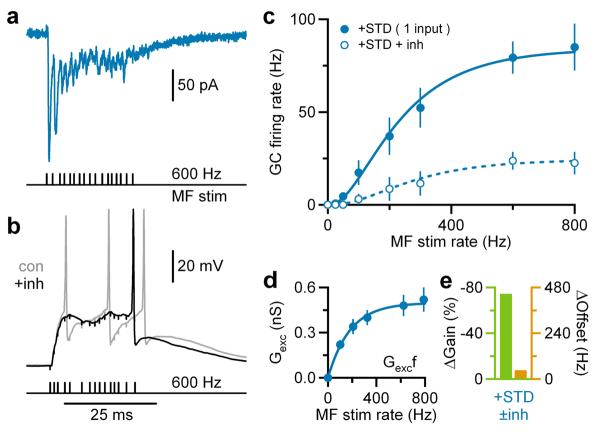
Figure 4. Gain modulation during broad bandwidth single mossy fibre stimulation.
a, Mixed AMPAR+NMDAR EPSCs in GCs during single MF, Poisson burst-like stimulation (black ticks) at −75mV. Stimulus artifacts subtracted.
b, Voltage responses to burst-like MF stimulation with and without tonic inhibition (±inh; black and gray; Ginh = 500 pS) injected via dynamic clamp. Black horizontal bar indicates firing rate measurement window. Vrest = −74mV.
c, Average GC input-output relation ±inh for single MF stimulation (n = 7) with Hill fits (Eq. 5).
d, Mean between relationship Gexc and MF stimulation rate (f). Blue line is an exponential fit (Eq. 4).
e, Gain (green) and offset (orange) changes due to inhibition (±inh) computed from fits in c.

