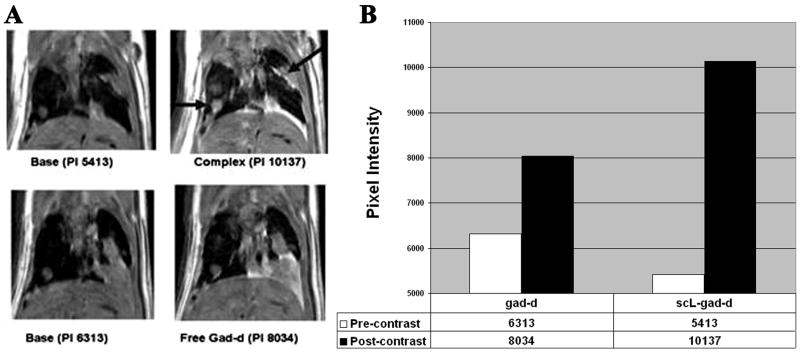
Figure 1. Metastases to lung in the RenCa lung metastasis model.
In this composite figure/chart, we compare the image of the same mouse imaged with both free gad-d and scL-gad-d. A-The base views show the respective pre-contrast images. PI = pixel intensity of the lower left lung nodule. B-This is graphically shown in the Chart that shows the enhancement from the precontrast images. The scL-gad-d complex shows greater enhancement than free gad-d in this metastasis. Arrows indicate the nodule measured and the enhancing pleural metastases.

