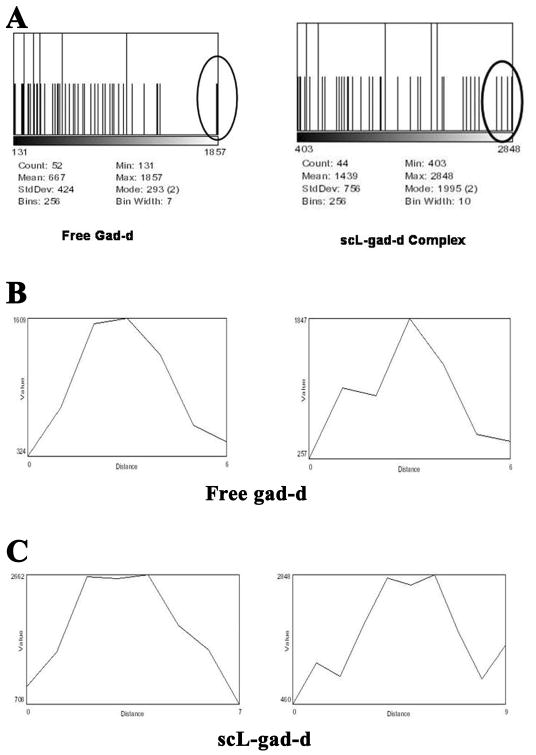
Figure 3. Histograms corresponding to the RenCa nodules in Figure 2.
A-These histograms of the region of the nodule display the spread of pixel intensities (x-axis) vs the number of pixels of that value (y-axis). The maximum y-axis for these images is 2 pixels. The histogram charts provide both the mean and standard deviation levels. B- Standard gad-d: Two profiles, one pixel apart, through the center of the upper nodule after enhancement with gad-d. C- scL-gad-d. Two profiles, one pixel apart, through the center of the upper nodule after enhancement with scL-gad-d.

