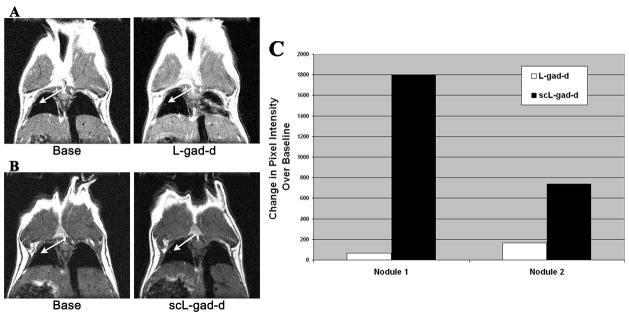
Figure 8. Comparison of MR image enhancement between targeted and unliganded complex.
In this composite figure/chart, we compare the image of the same mouse imaged with both scL-gad-d and unliganded gad-d (L-gad-d). A-The base view and post-contrast image after i.v. injection of the unliganded L-gad-d. B- The base view and post-contrast image after i.v. injection of the targeted scL-gad-d. C- A graph of the enhancement over baseline values with both agents.

