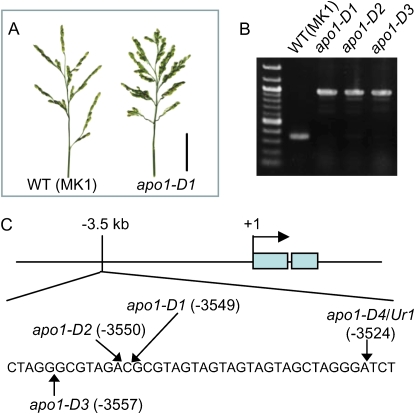
Figure 1.
Isolation of dominant mutants showing the inflorescence with increased branching. A, Inflorescence of wild type (WT; left) and apo1-D1 (right); bar = 5 cm. B, PCR amplification of APO1 promoter region in three apo1-D mutants and wild-type (‘MK1’) plants. C, Schematic representation of the APO1 gene. Positions of nDart1-0 insertion in the apo1-D mutants about 3.5 kb from the translation initiation site of APO1 are shown. The shaded boxes indicate the translated regions of APO1 starting at +1.

